


Imagine a man who tells you his renovation will cost $40,000. You ask how he knows. He explains that he assumed the lumber would be half price, the electrician would work at the rate his brother-in-law once charged, the permits would be waived, and the old wiring would pass inspection. He then added the figures and came up with $40,000. The arithmetic is correct. Nobody has learned what the renovation will cost.
Last month, five researchers led by Alison Galvani of Yale posted a preprint to medRxiv titled Projected economic gains and lives saved under universal healthcare in the United States. It reports that adopting a single-payer system would save the country $1.041 trillion a year and prevent 114,174 deaths. Those numbers have already begun their journey through the press, as large round figures tend to do.
The paper’s own authors call their method a “stepwise accounting framework,” which is an honest description of a procedure that adds assumed reductions to a national spending total and reports the remainder. The work is a static, one-year spreadsheet, and the largest inputs to that spreadsheet are precisely the questions in dispute. They begin with $5.2786 trillion in 2024 national health expenditures, then subtract $377.5 billion for lower drug prices, $295.6 billion for paying every provider at Medicare rates, $286.3 billion for reduced administration, $285.7 billion for reduced fraudulent billing, and $100 billion for emergency and inpatient care they presume would become unnecessary. Those five deductions alone total $1.345 trillion. After adding back some utilization and dental spending, the headline appears. Five policy hopes have been entered as line items, and their sum has been announced as a projection.
The $285.7 billion attributed to reduced fraud rests on a 2003 Health Affairs study of Taiwan’s transition to national health insurance. That study did not find an 8% reduction in fraud. It found the opposite direction entirely. Its authors calculated a residual rate of spending growth after adjusting for population, aging, prices, and income, and that residual jumped to nearly 8% in 1995, the year universal coverage began, which they attributed to the expansion of insurance itself. They were looking at leftover growth once the ordinary drivers had been stripped away. They then wrote plainly that the residual mixed insurance effects, cost controls, technology, production efficiency, and unknown factors were present, and that they could not isolate the individual components. A number describing an unexplained increase in spending has been relabeled as a recoverable fraud dividend and applied to the American system. That single move accounts for 27.4% of the entire headline.
The pharmaceutical cut fails by scope. The preprint applies a 51% price reduction across a consolidated category that includes drugs administered as part of other medical services. The study it cites, produced by several of the same authors, estimates $184 billion in total national savings from international reference pricing on outpatient prescription drugs, and its 51% figure applies specifically to private insurers. The corresponding reductions for Medicare, Medicaid, and out-of-pocket spending are different numbers. Taking the private-insurer rate, applying it to a broader base, and arriving at $377.5 billion produces a result roughly 2.05 times what the authors’ own source reports. Correct that single entry and the $1.041 trillion falls to $847.7 billion before anything else is touched.
Overhead, in this model, compresses across the entire system to Medicare’s current ratio, a $286.3 billion deduction, and the citation is Avik Roy’s fiscal analysis at the Foundation for Research on Equal Opportunity. Anyone who reads that analysis will find it arguing the reverse. Roy calls the standard Medicare-versus-private overhead comparison “highly flawed,” notes that Medicare’s low ratio partly reflects the enormous denominator created by an elderly population’s spending, and explains that administration performs necessary work including claims review, care management, and fraud prevention. He quotes Urban Institute researchers who conclude that 3% of administrative spending would be insufficient for a national program. The preprint has cited a rebuttal as though it were an endorsement.
The same model assumes that administrative spending collapses and that fraud recovery simultaneously reaches $285.7 billion. Auditing claims, investigating anomalous billing, conducting medical-necessity reviews, pursuing recoveries, and defending appeals are administrative activities. You cannot fire the auditors and collect the audits. The Centers for Medicare and Medicaid Services further warns that improper payment measurement “is not a measure of fraud,” and reported that 77.17% of Medicaid improper payments in fiscal year 2025 involved insufficient documentation rather than anything indicative of fraud or abuse. The Government Accountability Office reported this year that CMS still lacks detailed corrective action plans, carries a backlog of risk adjustment audits, and has not completed a comprehensive fraud risk assessment. Detection is not recovery, and paperwork errors are not crimes.
The $100 billion taken for avoidable hospital use is a hope entered as a fact. Timely primary care, on this theory, makes emergency and inpatient visits unnecessary, and the Oregon Health Insurance Experiment tested that hope under close to ideal conditions. Oregon allocated Medicaid slots by lottery in 2008, thereby creating a genuine randomized comparison among roughly 25,000 people. Coverage was not handed to the already healthy or withheld from the already sick because a lottery determined the assignments. Coverage raised emergency department use by 0.41 visits per person, or 40%, including visits for conditions ordinarily treatable in a primary care office. Lowering the price of care tends to increase use of all care. Whatever one concludes from Oregon, no one is entitled to enter the favorable outcome on the ledger as though it had already occurred.
Medicare rates for all hospitals and physicians are treated as $295.6 billion in national savings, and provider responses are explicitly excluded from the model. The Medicare Payment Advisory Commission found that hospitals’ fee-for-service Medicare margin was roughly negative 13% in fiscal 2023, that a quarter of hospitals already ran all-payer operating margins below negative 4%, and that even hospitals it judged relatively efficient posted a median Medicare margin of negative 2%. Those figures describe hospitals that are already losing money at the public rate. Some lose money on every payer at once, and even the efficient ones remain underwater on Medicare. The Congressional Budget Office, when it modeled single-payer options seriously, did not assume universal acceptance of Medicare rates. It used hospital payments at 123% or 142% of Medicare and physician payments at 111% or 120%. A model may make closures, service line cuts, and workforce departures vanish by assumption. Patients in rural counties cannot.
Of the 114,174 deaths, 29,631 are attributed to underinsurance, and the paper concedes in its own text that direct mortality estimates for the underinsured are not available. The authors therefore construct a hazard ratio of 1.25 by interpolating from survey data on cost-related forgone care, and they report the resulting death count to the nearest individual. Underinsurance, as the Commonwealth Fund defines it, is a financial classification triggered by out-of-pocket costs or deductibles crossing a share of household income. It is not a validated mortality stratum. Skipping a dental cleaning does not carry the same risk as skipping a cardiac medication, yet both can push a household across the same income threshold and into the same interpolated death count. Another 51,311 deaths come from a seperate forecast about 2025 policy changes, and of those, 31,200 concern prescription drug assistance and nursing home staffing rules rather than anyone losing insurance at all. The assumed multiplier plus the separate forecast make up 70.9% of the headline.
The remaining 33,232 deaths rest on a hazard ratio of 1.40, taken from a 2009 study of adults surveyed between 1986 and 1994, with a confidence interval of 1.06 to 1.84 that the preprint does not carry into its final number. A 2025 review in the Annual Review of Public Health does find credible causal evidence that gaining coverage reduces mortality. That same review deliberately excluded studies of exactly the design the preprint leans on, baseline cohort comparisons of insured and uninsured people, on the grounds that they cannot rule out selection on unobserved health. The best evidence for coverage does not license this particular arithmetic.
The paper does not model the bill it invokes. The Medicare for All Act of 2025 pays hospitals and skilled nursing facilities through negotiated quarterly global budgets rather than Medicare service rates. It eliminates nearly all patient cost sharing, which would raise demand among the privately insured and existing Medicare beneficiaries, populations CBO estimates would increase utilization by 8% to 14% and 4% to 12%, respectively, and which the preprint’s utilization line simply omits. It requires at least 1% of the national health budget for up to five years to assist displaced administrative workers, roughly $42.4 billion annually at the paper’s own spending level, which the model carries at zero, and it includes vision and hearing benefits the authors leave out while asserting the cost would be modest. The deepest confusion of all is the treatment of national health expenditures as though they were the federal budget, when CBO found that federal subsidies would rise by $1.5 trillion to $3 trillion in 2030 under every option it examined, so the preprint’s closing claim that the plan “requires no new discovery to implement, only enactment” arrives with no tax schedule, no state maintenance-of-effort analysis, and no transition budget attached.
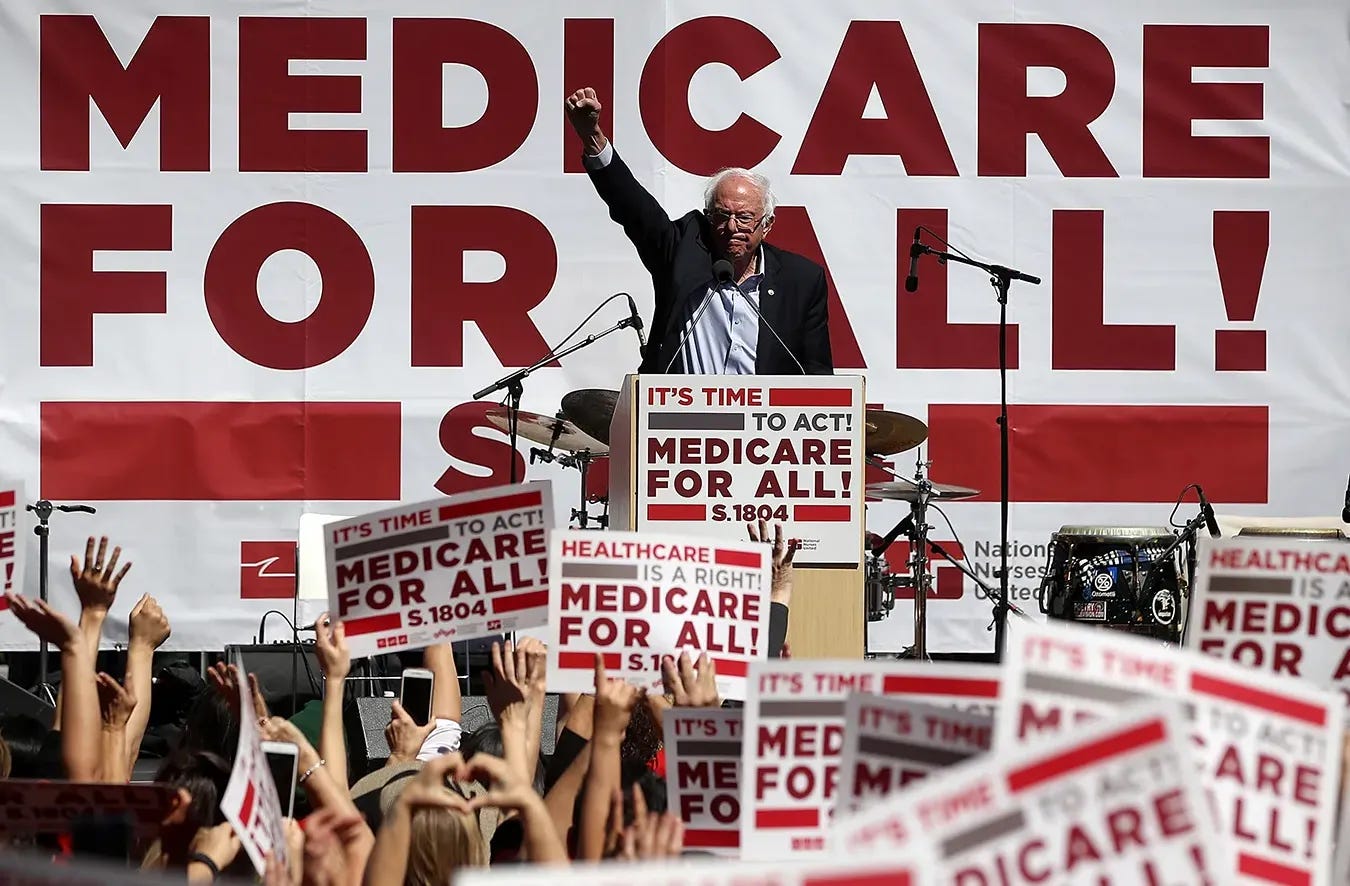
Galvani served as an informal unpaid adviser to Bernie Sanders’s Senate office while it drafted Medicare for All legislation, a fact disclosed in her team’s 2020 Lancet paper, and in July 2025 she testified before the Senate HELP Committee in favor of the Sanders proposal while citing her own group’s savings and mortality estimates. The research team is composed largely of infectious disease modelers, with no hospital finance specialist, health actuary, program integrity investigator, or tax economist among them. That composition explains why the model is fluent in attributable fractions and silent on hospital margins, payment architecture, and federal finance. What it produces is engaged advocacy research, published without peer review, in support of a bill its lead author helped shape and has publically championed.
Strip the four most contestable deductions, and roughly 84% of the savings evaporate. The paper shows what its authors believe single payer could accomplish if a series of favorable assumptions held simultaneously, which the citations already on the page give reason to doubt. At the end of the day, the paper is advocacy posing as academic research.
If you enjoy my work, please subscribe https://x.com/amuse/creator-subscriptions/subscribe
Alexander Muse is a Fellow at the John Milton Freedom Foundation and publishes daily political analysis at amuseonx.com. Primary sources cited in this piece are linked inline; campaign finance figures are drawn from FEC filings, polling data from publicly released crosstabs, and legal claims from filed pleadings. Corrections are posted to the original URL with a dated changelog. Readers who identify errors are invited to contact the author directly. Each op-ed edited for grammar and clarity using Ai in partnership with Grammarly. Data provided in a sponsored partnership with Polymarket.
Here we go again! You would think that someone would be suspicious after the travesty that was/is Obamacare
Even though I don't understand all the numbers, I can see the sense in what you are saying. Basically, use the correct calculations to get the correct answers. Generally, numbers don't lie but they can be manipulated. I know the Democrats will run with this as far as they can. Sad that the majority of them will not read your article or do any research on this at all. Thank you for your consistent clarity!